Estimating Emissions from Sources of Air Pollution
6.1 Development of an Emissions Inventory
6.1.9 The International Environmental Database System
6.1.9.1 Introduction
The International Environmental Database, or IED system, is an open source emission inventory database system integrated with a large number of emission factors and basic activity patterns to address both local air pollution and global climate change concerns. The database system is designed to cover all sources of pollution from factories and other businesses to airports, trains, shipping ports, and even small private sources. The system will also accommodate the estimation and tracking of solid and liquid waste as well as energy and product flows. The goal of the IED is to provide an effective harmonized approach to emission inventory and other flow management that can be easily implemented in urban areas in developing countries. The intention is for the database system to support an understanding of the sources of both local and global air quality impacts along with water and solid waste pollution.
The air quality, water quality, and solid waste management activities of government can often be spread over multiple government agencies. The IED is an internet based system that allows multiple local government agencies to securely access and work on the same emissions database to insure the most reliable data. It is also possible for a single facility to set up and apply the IED to its operations in order to maintain a private emission inventory database.
It should be noted that although IED is often referred to as a database, it actually consists of three separate databases that reside on a single internet server. There is a primary database, which holds all of the core environmental information, a privileges database, which holds information on the names of approved database users and their privileges in using the system, and an emission credit database, which holds information on emission credits and the history of their creation and ownership.
6.1.9.2 Database Concept and Structure Design
As discussed in the previous section, the IED is intended to serve several air quality management objectives. The database is arranged into about 90 tables to accomplish the desired tasks; although the typical database user will likely not need to understand this structure unless they decide to add components to the system since there are software functions designed to manage the various database activities.
The IED is built around the concept of a source. A source is normally an entity that uses energy and produces a product, but also pollutes the atmosphere, water, and land. As noted earlier, a source can be of many types. For example, it can be a manufacturing facility, a home heating unit, a train, a bus fleet, or a forest fire.
Assoiated with each source are one or more processes and with each process one or more flows. A process is a sub-category of a source. A source can have many processes. In the case of a manufacturing facility such as a cement production plant, the processes will include various types, such as “materials receiving” , “materials crushing and mixing”, “kilns”, “final grinding” processes, “bagging” and so on.
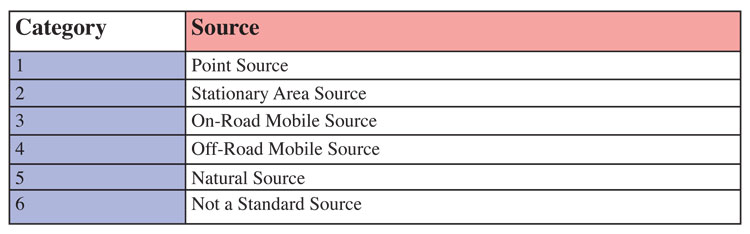
Processes have flows that enter and leave the process. Some of the flows provide raw materials and energy to the process. Some of the flows are the product of the process. Some of the flows are pollutants that go into the air or water or landfills. Table 6.1.9-1 shows the source classifications normally used in the IED.
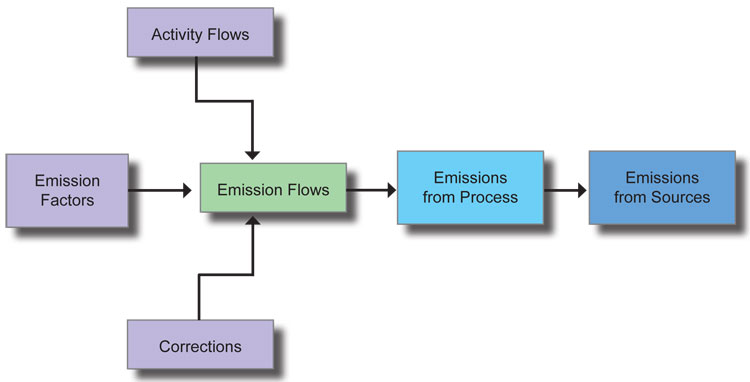
The emissions or flows can be entered or calculated for each process. Then, the emissions from each process are added together to produce a complete emission inventory. IED is designed to grow with the user. It is not reasonable that all emissions or energy flow or product flow or many other types of information will be available to the air quality management process at the beginning. Thus, the IED is designed so that useable results can be achieved without having all possible data entered into the database. Figure 6.1.9-2 shows the calculation flow in IED in the case where emission factors are used.
6.1.9.3 Database Management
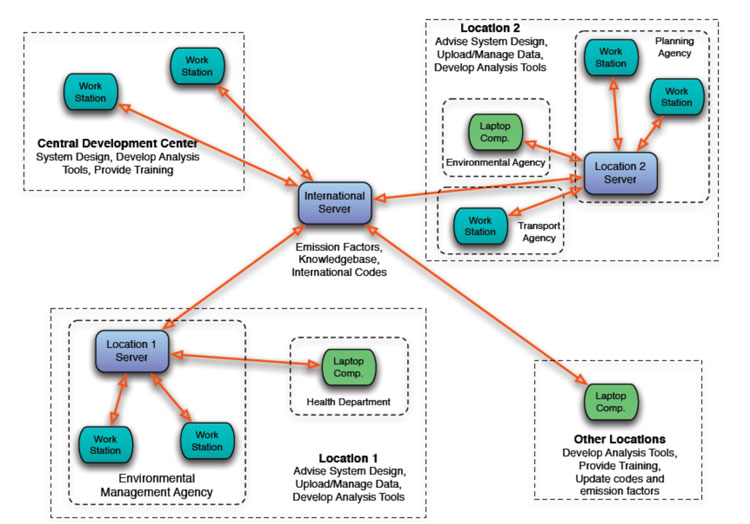
Within a single country, the different government agencies with air quality responsibilities will be able to share and work on a single air quality database. It is also possible for multiple partners to work on the same air quality data from anywhere in the world if they are approved an provided with a user name and password. With a standardized relational database system, partners can share software to accomplish policy analysis rather than re-invent it at each location. Any interested party can produce third party analysis software to make use of a standardized database from anywhere in the world. Calculations will be made in a consistent and more accurate manner. Emerging air quality concerns can be more easily factored into the decision making process. Figure 6.1.9-3 shows how the IED is designed to work.
6.1.9.4 Case Study of Database Operation
An example system has been set up at www.iedmetropolis.org for review. The reviewer should use the user name of “user1” and the password “user1”. For security purposes, “user1” does not have access to all of the database management tools but can try out some key features. (Metropolis is the hometown of Superman and this imaginary city was created to allow testing of the software before deployment. It is constantly under modification at this point in time).
1) Upload Data
One of the main challenges of working with a database is uploading data into the database. Uploading data can be very difficult if the user does not have the right tools to perform this task. The IED provides multiple options for loading data through the use of specific web pages. The DataLoad.php webpage serves as a tool where the user can easily upload data to the database. Using the DataLoad.php webpage approved users can Append Data, Update Data, Replace Data and Reload Data. In the case of user1, data can only be uploaded so that the other options do not show up. This is part of the security built into the database. In the following paragraphs the user will find the description of each command and the instructions to work with the DataLoad.php webpage. Figure 6.1.9-4 is an example of DataLoad.php webpage.
A dropdown menu is where the user must select the table in which the data will be uploaded. On the Command List the user can select the command that he wants to perform with the data that will be uploaded. There are 4 options: “Append Data”, “Update Data”, “Replace Data” and “Reload Data”. The user must enter the data to be uploaded into the Input Area. Normally this is achieved by performing a copy and paste command from a spreadsheet or text program, however it can also be accomplished by simply typing into the text box. More detail could be found in IED user manual.
2) Calculate Emissions
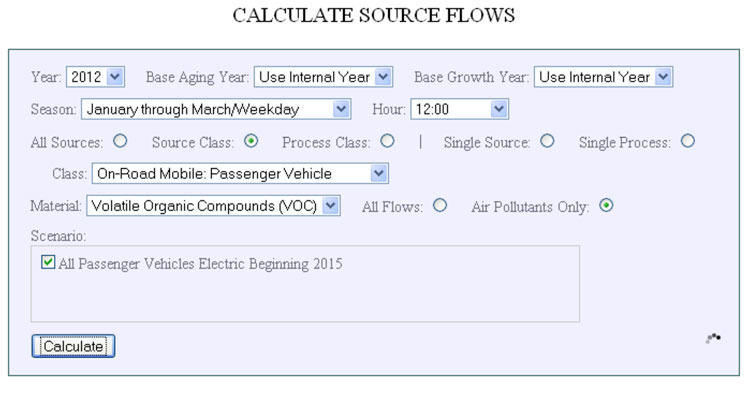
After basic activity and technology information is placed into the IED, users can start creating emission inventories. The Calculate Source Flows page allows the user to make calculations of the various flows contained in the database. This includes emissions into the air but it could also be electricity use and any other flow data contained in the database. The time scale, special corrections, target pollutants and sources can be defined by the user, the IED also provides a “scenario” function for users to estimate flows for previously defined database changes such as control scenarios. Figure 6.1.9-5 shows the basic function in Calculation page.
3) Emission Results Display
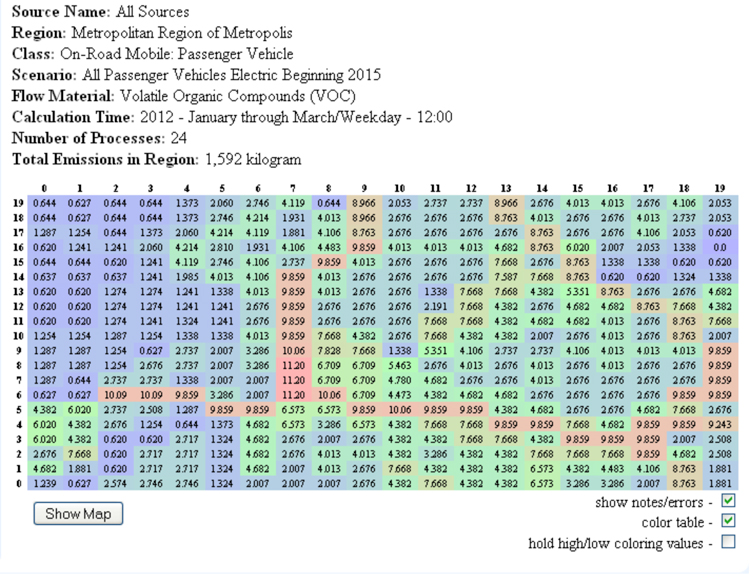
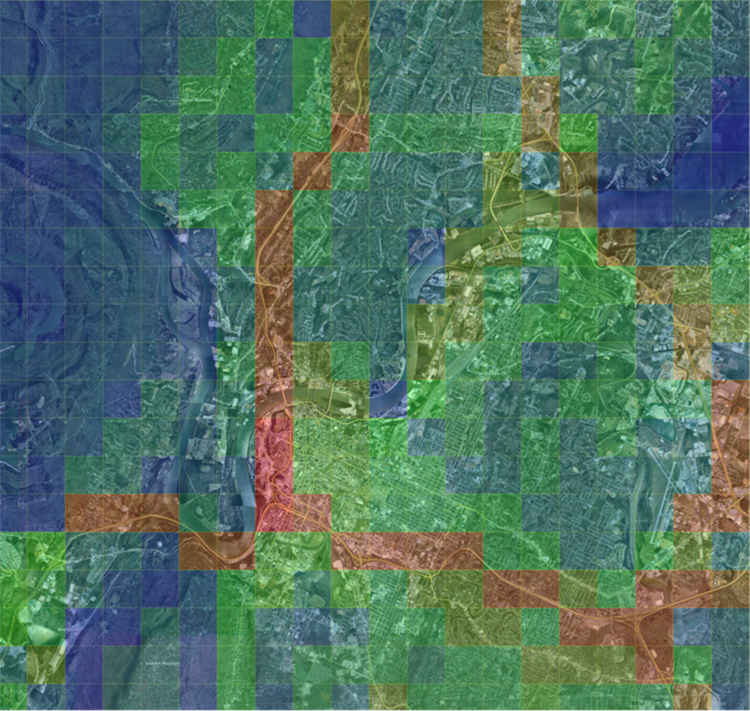
Once all of the requirements are specified to the IED, the server will start calculating the emission inventory. The results can be shown as values grid by grid (such as figure 6.1.9-6). Also, combined with graphic information, the emission inventory could be output as a colorized map, which shows more local geographical information (Figure 6.1.9-7).
As mentioned before, about 90 tables are included in the database to accomplish the desired tasks. The actual calculation and simulation can be very complex. Please refer to the IED Users Manual for more information. Training is recommended for local users before they begin working with the IED. The IED model interface now includes Chinese, English, Spanish, and Portuguese.
6.1.9.5 Conclusion
The previous discussions are intended to give a very brief overview of the IED database system. The system has many options not discussed here and as with all open source software, it is constantly undergoing improvement and additions. The software is available for free from ISSRC. The system is in operation in Chongqing, China and Guadalajara, Mexico with good results to date. Application of the IED is also underway for Mexico City, Mexico, Sao Paulo, Brazil, and Shanghai, China.
The International Environmental Database, or IED system, is an open source emission inventory database system integrated with a large number of emission factors and basic activity patterns to address both local air pollution and global climate change concerns. The database system is designed to cover all sources of pollution from factories and other businesses to airports, trains, shipping ports, and even small private sources. The system will also accommodate the estimation and tracking of solid and liquid waste as well as energy and product flows. The goal of the IED is to provide an effective harmonized approach to emission inventory and other flow management that can be easily implemented in urban areas in developing countries. The intention is for the database system to support an understanding of the sources of both local and global air quality impacts along with water and solid waste pollution.
The air quality, water quality, and solid waste management activities of government can often be spread over multiple government agencies. The IED is an internet based system that allows multiple local government agencies to securely access and work on the same emissions database to insure the most reliable data. It is also possible for a single facility to set up and apply the IED to its operations in order to maintain a private emission inventory database.
It should be noted that although IED is often referred to as a database, it actually consists of three separate databases that reside on a single internet server. There is a primary database, which holds all of the core environmental information, a privileges database, which holds information on the names of approved database users and their privileges in using the system, and an emission credit database, which holds information on emission credits and the history of their creation and ownership.
6.1.9.2 Database Concept and Structure Design
As discussed in the previous section, the IED is intended to serve several air quality management objectives. The database is arranged into about 90 tables to accomplish the desired tasks; although the typical database user will likely not need to understand this structure unless they decide to add components to the system since there are software functions designed to manage the various database activities.
The IED is built around the concept of a source. A source is normally an entity that uses energy and produces a product, but also pollutes the atmosphere, water, and land. As noted earlier, a source can be of many types. For example, it can be a manufacturing facility, a home heating unit, a train, a bus fleet, or a forest fire.
Assoiated with each source are one or more processes and with each process one or more flows. A process is a sub-category of a source. A source can have many processes. In the case of a manufacturing facility such as a cement production plant, the processes will include various types, such as “materials receiving” , “materials crushing and mixing”, “kilns”, “final grinding” processes, “bagging” and so on.
Processes have flows that enter and leave the process. Some of the flows provide raw materials and energy to the process. Some of the flows are the product of the process. Some of the flows are pollutants that go into the air or water or landfills. Table 6.1.9-1 shows the source classifications normally used in the IED.
The emissions or flows can be entered or calculated for each process. Then, the emissions from each process are added together to produce a complete emission inventory. IED is designed to grow with the user. It is not reasonable that all emissions or energy flow or product flow or many other types of information will be available to the air quality management process at the beginning. Thus, the IED is designed so that useable results can be achieved without having all possible data entered into the database. Figure 6.1.9-2 shows the calculation flow in IED in the case where emission factors are used.
6.1.9.3 Database Management
Within a single country, the different government agencies with air quality responsibilities will be able to share and work on a single air quality database. It is also possible for multiple partners to work on the same air quality data from anywhere in the world if they are approved an provided with a user name and password. With a standardized relational database system, partners can share software to accomplish policy analysis rather than re-invent it at each location. Any interested party can produce third party analysis software to make use of a standardized database from anywhere in the world. Calculations will be made in a consistent and more accurate manner. Emerging air quality concerns can be more easily factored into the decision making process. Figure 6.1.9-3 shows how the IED is designed to work.
6.1.9.4 Case Study of Database Operation
An example system has been set up at www.iedmetropolis.org for review. The reviewer should use the user name of “user1” and the password “user1”. For security purposes, “user1” does not have access to all of the database management tools but can try out some key features. (Metropolis is the hometown of Superman and this imaginary city was created to allow testing of the software before deployment. It is constantly under modification at this point in time).
1) Upload Data
One of the main challenges of working with a database is uploading data into the database. Uploading data can be very difficult if the user does not have the right tools to perform this task. The IED provides multiple options for loading data through the use of specific web pages. The DataLoad.php webpage serves as a tool where the user can easily upload data to the database. Using the DataLoad.php webpage approved users can Append Data, Update Data, Replace Data and Reload Data. In the case of user1, data can only be uploaded so that the other options do not show up. This is part of the security built into the database. In the following paragraphs the user will find the description of each command and the instructions to work with the DataLoad.php webpage. Figure 6.1.9-4 is an example of DataLoad.php webpage.
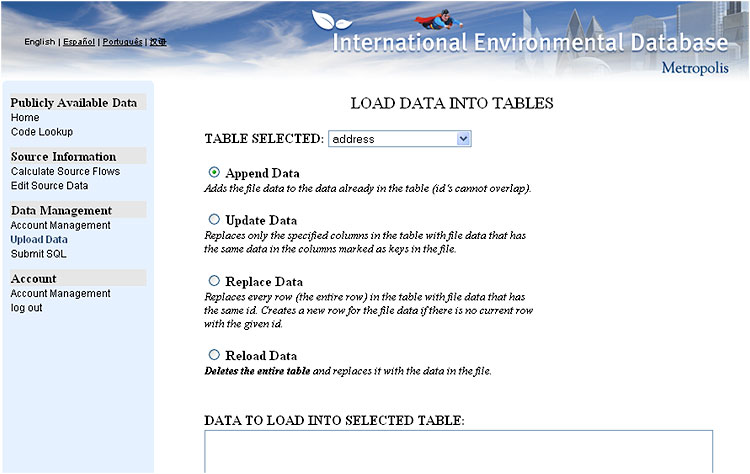
A dropdown menu is where the user must select the table in which the data will be uploaded. On the Command List the user can select the command that he wants to perform with the data that will be uploaded. There are 4 options: “Append Data”, “Update Data”, “Replace Data” and “Reload Data”. The user must enter the data to be uploaded into the Input Area. Normally this is achieved by performing a copy and paste command from a spreadsheet or text program, however it can also be accomplished by simply typing into the text box. More detail could be found in IED user manual.
2) Calculate Emissions
After basic activity and technology information is placed into the IED, users can start creating emission inventories. The Calculate Source Flows page allows the user to make calculations of the various flows contained in the database. This includes emissions into the air but it could also be electricity use and any other flow data contained in the database. The time scale, special corrections, target pollutants and sources can be defined by the user, the IED also provides a “scenario” function for users to estimate flows for previously defined database changes such as control scenarios. Figure 6.1.9-5 shows the basic function in Calculation page.
3) Emission Results Display
Once all of the requirements are specified to the IED, the server will start calculating the emission inventory. The results can be shown as values grid by grid (such as figure 6.1.9-6). Also, combined with graphic information, the emission inventory could be output as a colorized map, which shows more local geographical information (Figure 6.1.9-7).
As mentioned before, about 90 tables are included in the database to accomplish the desired tasks. The actual calculation and simulation can be very complex. Please refer to the IED Users Manual for more information. Training is recommended for local users before they begin working with the IED. The IED model interface now includes Chinese, English, Spanish, and Portuguese.
6.1.9.5 Conclusion
The previous discussions are intended to give a very brief overview of the IED database system. The system has many options not discussed here and as with all open source software, it is constantly undergoing improvement and additions. The software is available for free from ISSRC. The system is in operation in Chongqing, China and Guadalajara, Mexico with good results to date. Application of the IED is also underway for Mexico City, Mexico, Sao Paulo, Brazil, and Shanghai, China.