Air Quality and Health and Welfare
2.10 Methodologies and State of the Art for Quantifying the Health Impacts of Air Pollution
2.10.5 Case Study of Estimating Health Impacts from Retrofitting Diesel Trucks in Beijing, China Using a Simple Analysis Approach
2.10.5.1 Overview
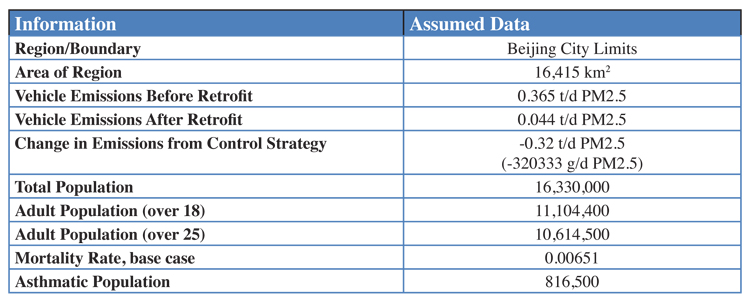
To demonstrate the methodology of estimating health impacts from a change in emissions, an example in Beijing, China is used. The following are the assumed details of this case study:
Step 1. Determine the relationship between pollution levels and health effects (β)
Since there will be no new studies conducted, we will use existing values referenced above in 2.10.5-1.
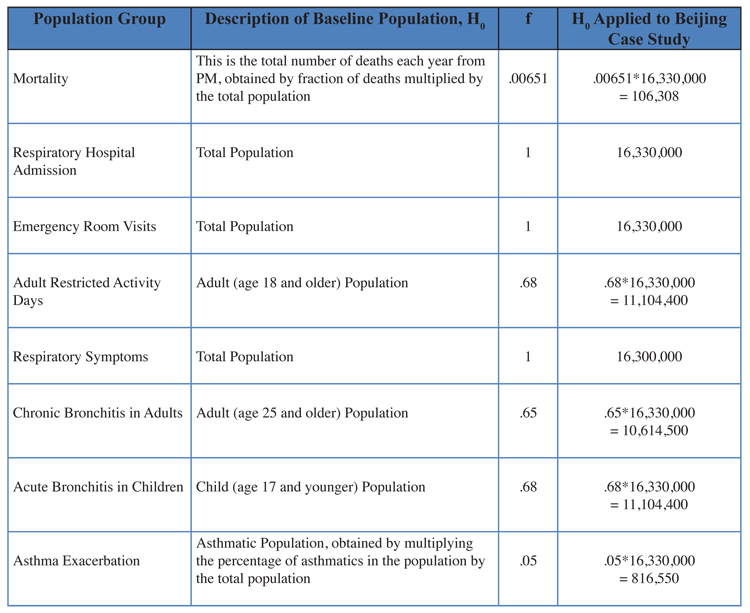
Step 2. Determine the number of cases of health effects in the baseline case (H0)
For this case study, the data shown in table 2.10.5-2 is used to estimate the baseline population for each health condition.
Step 3. Determine the change in ambient pollution levels for the control measures in study (ΔA)
Several methods are used to estimate the change in ambient concentration as a result of the change in emissions from the retrofit program. The results are then compared.
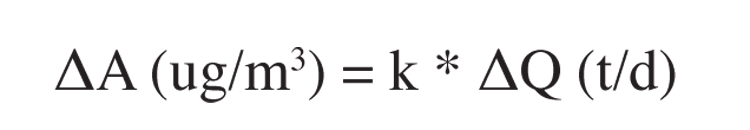
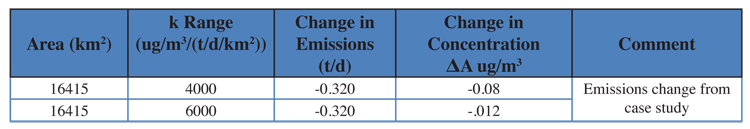
Rollback: Because there is no available air quality modeling for this city or carrying capacity estimate, the k coefficient cannot be calculated directly. So, the typical k range of 4000-60000 that was given in the discussion is applied. For the region that is 16415 km2 in size, a change in emissions of -0.32 t/d will result in a concentration change of between -0 .08 and -0.12 ug/m3 using the ambient rollback equation listed below, which was derived in the previous section. A mid-range change is -0.1 ug/m3.
Where k is in ug/m3/(t/d/km2)

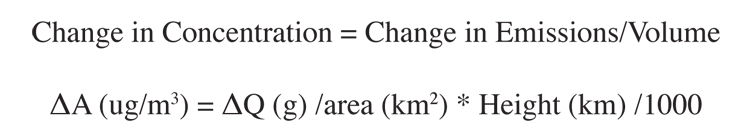
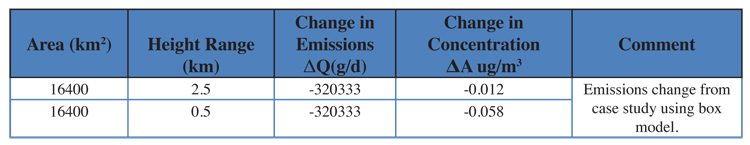
Box Model: A mixing height of 500 to 2500 meters is used here for this analysis, and an average wind speed of 2 m/s is used as well. The volume of the box is then simply the area of the region multiplied by the height of the mixed layer. The concentration can be calculated by:
We assume the average wind speed is 1 m/s meaning the inversion layer breaks, or roughly the wind creates an air exchange every day and a half. Then the emissions change is calculated for one day over the region and applied to equation 2.10.5-5. The ambient concentration change for the mid-range height is around 0.035 ug/m3 using this box model analysis for this example, as compared with 0.1 using the same parameters in the rollback model approach.
Intake Fraction: A third method for estimating the change in ambient pollution levels is used for this case study since information exists from an intake fraction study conducted in China recently (Ho, 2007). Ho reports that the intake fraction for transportation on average in China is 7.7* 10-5. This means that on average, for every million grams of PM matter emitted from a vehicle, 77 grams is inhaled by the population. The intake fraction can be used to estimate the ambient concentration change, and the formula is recalled by the derivation in the last section:
Where Δ A is in ug/m3 and ΔQ is in g/s, BR is in m3/s.
Converting ΔQ into the proper units gives: -320333 g/d / 86400 s/d = -3.7 g/s
Ho, et. al used a breathing rate of 20 m3/d ( or 0.0023 m3/s) to develop this intake fraction. Therefore, the change in ambient concentrations using this approach is:
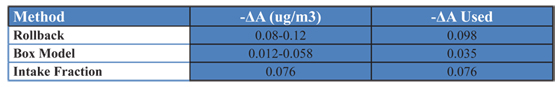
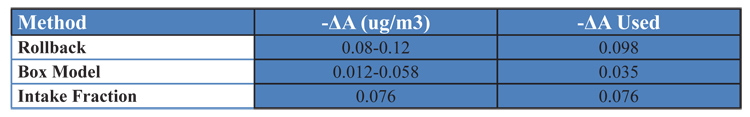
A comparison of the mid range of the estimates is shown in table 2.10.5-9. All of these data are used to estimate a range of health effects in Step 4.
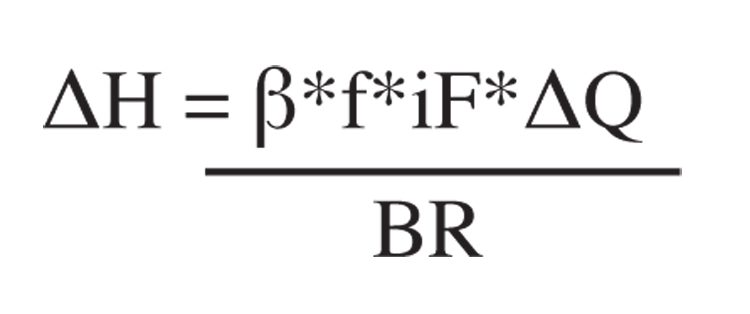
Step 4. Apply the exposure function to calculate the change in health effect cases due to the control measures. (ΔH)
Once the ambient pollution change, population affected, and DR coefficient have been determined, the calculation of change in health impacts can be calculated from 2.10.5-10 from the range of the estimated pollution changes: and 2.10.5-11 for the intake fraction methodology: The mid-range DR coefficients were used for all calculations in this table. The mid-range concentration estimate indicates about 22 deaths would be avoided and about 300 emergency room visits with the reduction from the Beijing retrofit case study of .32 tons/day decrease in PM10.
Thus, this simplified health impact analysis indicates that there was considerable health benefits to making the retrofits to lower emissions from certain diesel vehicles in Beijing.
To demonstrate the methodology of estimating health impacts from a change in emissions, an example in Beijing, China is used. The following are the assumed details of this case study:
Step 1. Determine the relationship between pollution levels and health effects (β)
Since there will be no new studies conducted, we will use existing values referenced above in 2.10.5-1.
Step 2. Determine the number of cases of health effects in the baseline case (H0)
For this case study, the data shown in table 2.10.5-2 is used to estimate the baseline population for each health condition.
Step 3. Determine the change in ambient pollution levels for the control measures in study (ΔA)
Several methods are used to estimate the change in ambient concentration as a result of the change in emissions from the retrofit program. The results are then compared.
Rollback: Because there is no available air quality modeling for this city or carrying capacity estimate, the k coefficient cannot be calculated directly. So, the typical k range of 4000-60000 that was given in the discussion is applied. For the region that is 16415 km2 in size, a change in emissions of -0.32 t/d will result in a concentration change of between -0 .08 and -0.12 ug/m3 using the ambient rollback equation listed below, which was derived in the previous section. A mid-range change is -0.1 ug/m3.
Where k is in ug/m3/(t/d/km2)
2.10.5-4 Rollback Model Applied to Beijing Case Study to Calculate Change in Pollution Levels
Box Model: A mixing height of 500 to 2500 meters is used here for this analysis, and an average wind speed of 2 m/s is used as well. The volume of the box is then simply the area of the region multiplied by the height of the mixed layer. The concentration can be calculated by:
We assume the average wind speed is 1 m/s meaning the inversion layer breaks, or roughly the wind creates an air exchange every day and a half. Then the emissions change is calculated for one day over the region and applied to equation 2.10.5-5. The ambient concentration change for the mid-range height is around 0.035 ug/m3 using this box model analysis for this example, as compared with 0.1 using the same parameters in the rollback model approach.
Intake Fraction: A third method for estimating the change in ambient pollution levels is used for this case study since information exists from an intake fraction study conducted in China recently (Ho, 2007). Ho reports that the intake fraction for transportation on average in China is 7.7* 10-5. This means that on average, for every million grams of PM matter emitted from a vehicle, 77 grams is inhaled by the population. The intake fraction can be used to estimate the ambient concentration change, and the formula is recalled by the derivation in the last section:
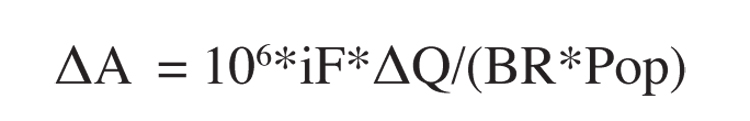
Where Δ A is in ug/m3 and ΔQ is in g/s, BR is in m3/s.
Converting ΔQ into the proper units gives: -320333 g/d / 86400 s/d = -3.7 g/s
Ho, et. al used a breathing rate of 20 m3/d ( or 0.0023 m3/s) to develop this intake fraction. Therefore, the change in ambient concentrations using this approach is:

A comparison of the mid range of the estimates is shown in table 2.10.5-9. All of these data are used to estimate a range of health effects in Step 4.
2.10.5-9 Comparison of the Change in Ambient Concentration in Case Study using Three Methods
Step 4. Apply the exposure function to calculate the change in health effect cases due to the control measures. (ΔH)
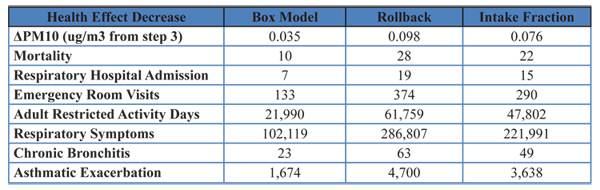
Once the ambient pollution change, population affected, and DR coefficient have been determined, the calculation of change in health impacts can be calculated from 2.10.5-10 from the range of the estimated pollution changes: and 2.10.5-11 for the intake fraction methodology: The mid-range DR coefficients were used for all calculations in this table. The mid-range concentration estimate indicates about 22 deaths would be avoided and about 300 emergency room visits with the reduction from the Beijing retrofit case study of .32 tons/day decrease in PM10.

2.10.5-12 Estimated Decrease in Health Effects using Simplified Analysis – Beijing Retrofit Case Study of Decreased Emissions of 0.32 t/d
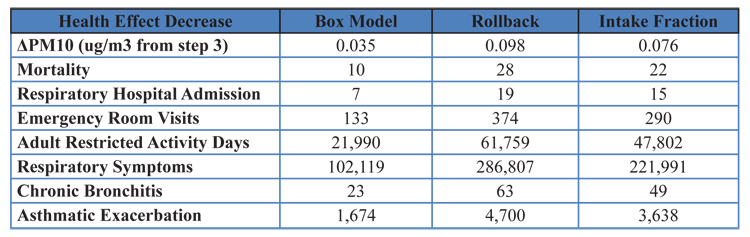
Thus, this simplified health impact analysis indicates that there was considerable health benefits to making the retrofits to lower emissions from certain diesel vehicles in Beijing.